Using the Kibana dashboard and Elasticsearch
Kibana is a simple visualization tool that pulls from an Elasticsearch data store.
Access Kibana
Kibana is accessed through a web interface, typically on port 5601. Accessing on a local machine:
https://localhost:5601
Importing Searches, Visualizations, and Dashboards
The pan-tort Kibana files are kept in the kibana_json folder. The 3 files can be easily imported to Kibana to be data view ready.
Import is found under Management –> Saved Objects. The Import button in the upper right corner.
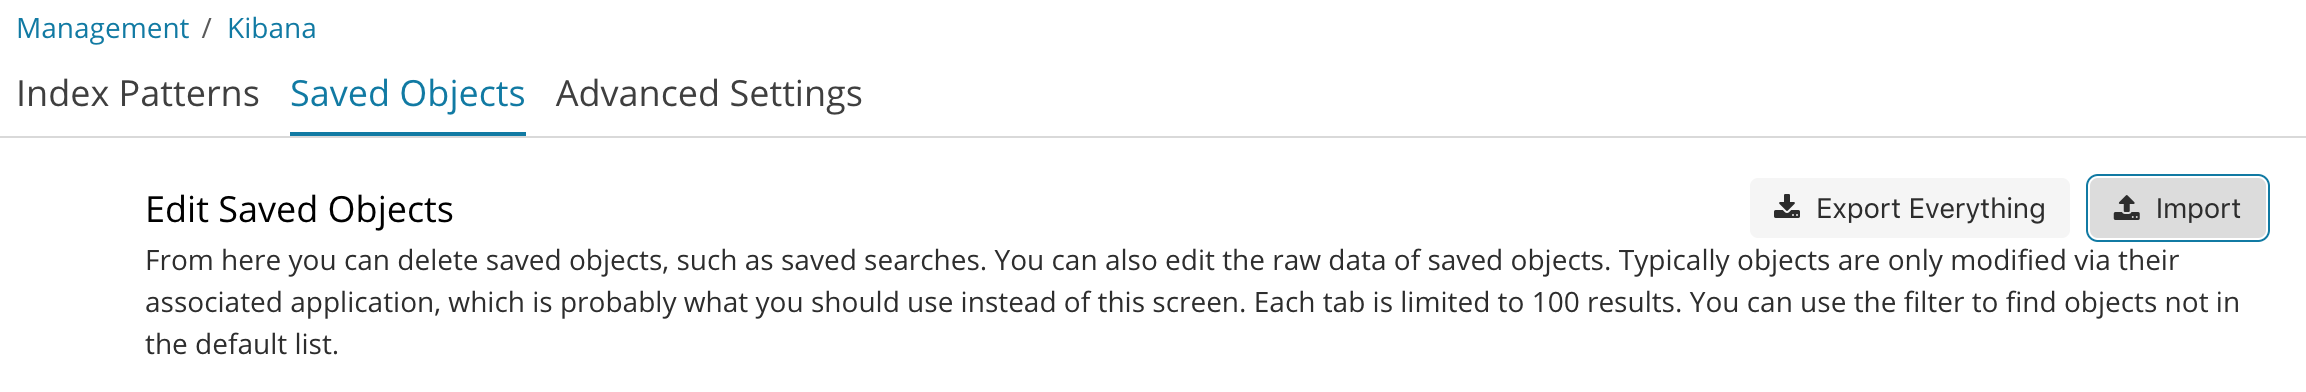
Import the 3 files in the following order to ensure no reference errors:
- hash_data_searches.json
- hash_data_visualizations.json
- hash_data_dashboards.json
Accessing the pan-tort dashboard
Use the Kibana menu to choose the dashboard option.

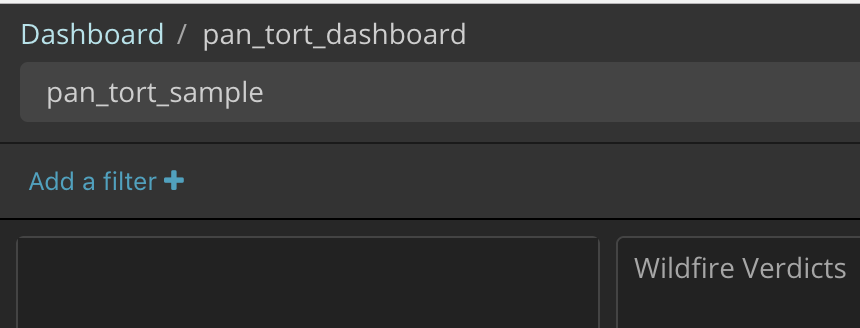
Select `pan_tort_dashboard`
The pan-tort dashboard will display.
Note
The data is time based and some test samples may be 6 years old. If the dashboard is not set to look back
that far in time, update with the time selector in the upper right hand corner. The best option is to choose
`Relative` and use 6 `Years Ago` to `Now`
Using the Search bar to filter results
When you run pan-tort, you are asked for a brief name for the query. This name is added to the data records. In the search bar, text box above the dashboard, enter the query name.
This will filter the results to include on the specific query.
To switch between various queries, simple type in the name in the search box and the dashboard will udpate.
Elasticsearch quick loads and deletes
Elasticsearch is the document storage layer used with Kibana presentation. This is not intended as an Elasticsearch tutorial, but only to give quick commands for adding and remove bulk sets of data.
Sample data bulk load
The output of pan-tort used for Elasticsearch is in the out_estack directory. This is data is json formatted with data lines preceded by an index line to feed into Elasticsearch.
The general format to add data into Elasticsearch is:
curl -s -XPOST 'http://localhost:9200/_bulk' --data-binary @{filename}.json -H "Content-Type: application/x-ndjson"
If in the hash directory running pan-tort, then the curl command for a filename of pan_tort_sample would be:
curl -s -XPOST 'http://localhost:9200/_bulk' --data-binary @out_estack/pan_tort_sample.json -H "Content-Type: application/x-ndjson"
Files are loaded using the same pan-tort index and unique per query run using the query name.
Elasticsearch delete by query example
In some cases data may be entered as a duplicate or by accident. Using the dev tools option in Elasticsearch, data can be removed from the index specific to the query name.
The dev tools console is accessed from the main menu. Add the POST statement per below with the update query_tag name. Then hit the green play button to execute the POST. The results are displayed in the output window.
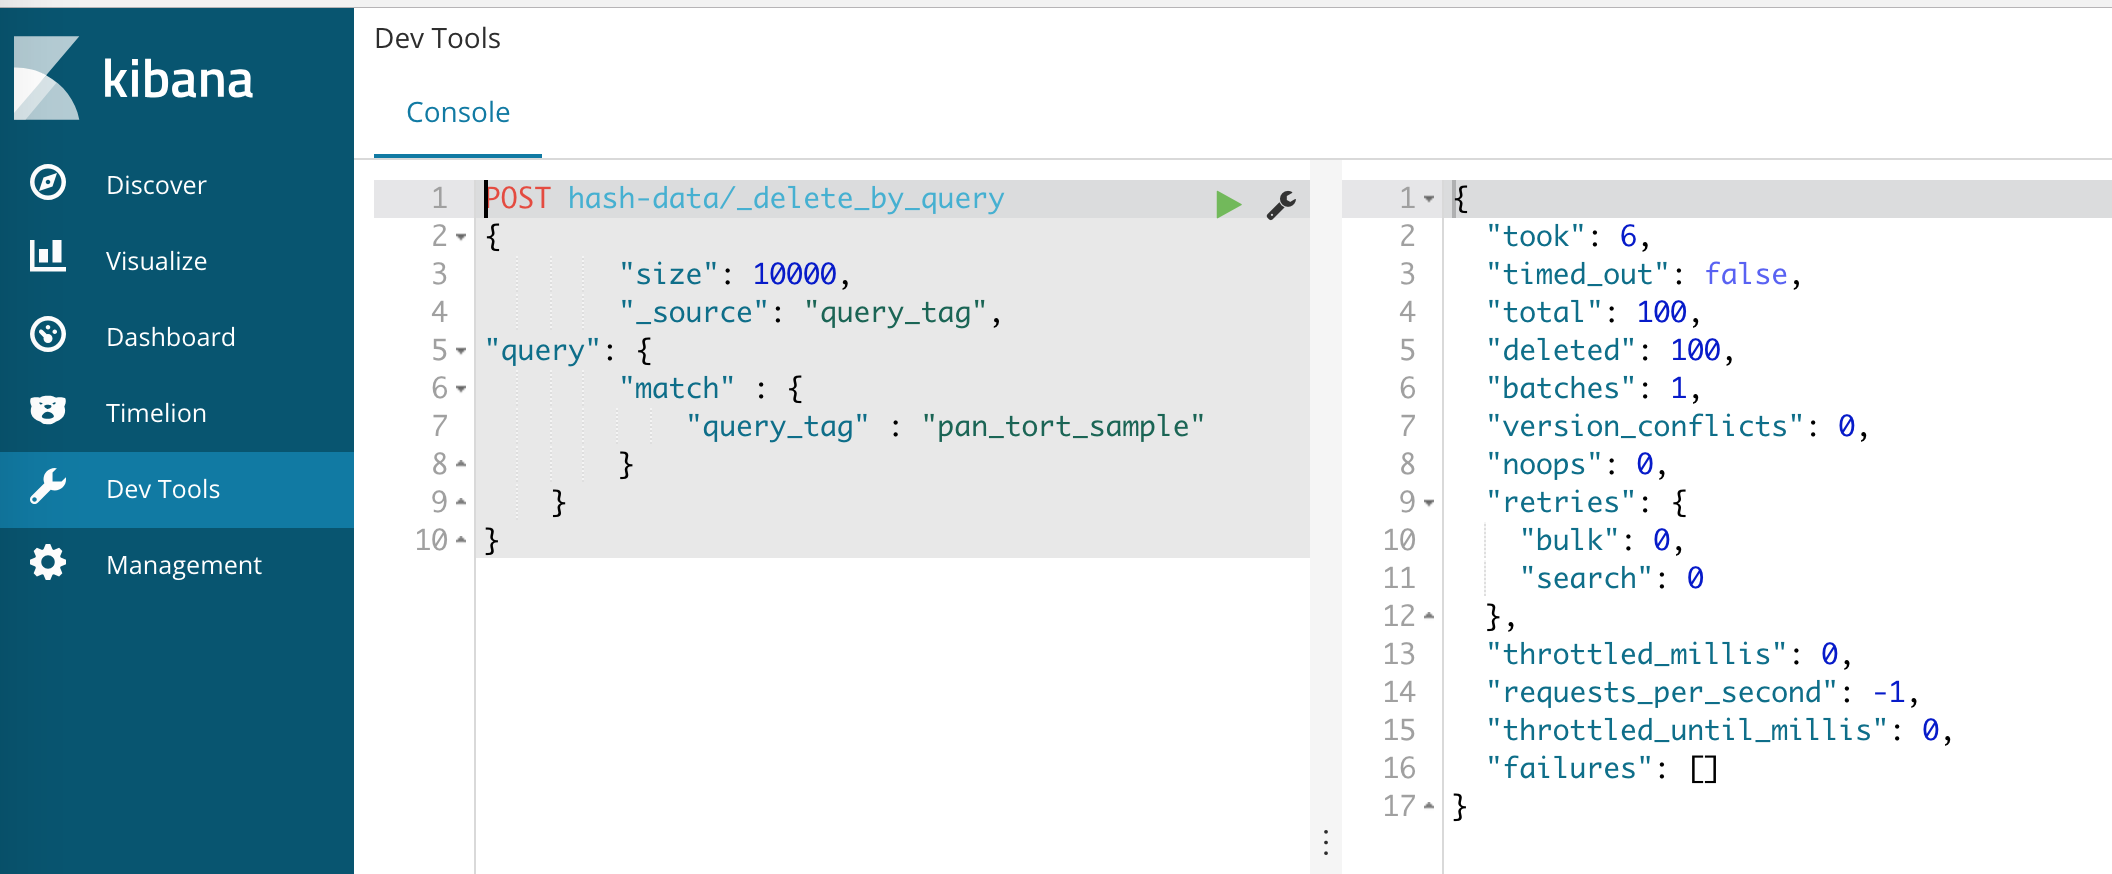
The example below can be cut-and-paste into the dev tools window with the query_tag updated for data to be deleted.
POST hash-data/_delete_by_query
{
        "size": 10000,
        "_source": "query_tag",
"query": {
        "match" : {
            "query_tag" : "pan_tort_sample"
        }
    }
}
The delete_by_query command can be executed for each query_tag value.
If all data is to be removed for a clean index, use the curl command below. This will delete ALL data in the hash-data index store so proceed with caution.
Delete existing data in the index
- ::
- curl -XDELETE http://localhost:9200/{{elk_index_name}}
Pan-tort uses the index name of `hash-data`.
Warning
This command deletes ALL data in the index. Use only to reset to a clean data store.
Warning
This command deletes ALL data in the index. Use only to reset to a clean data store.